Quick Tip: Mermaid – Representing and Creating Diagrams Using Text
I work with diagrams and visualizations a lot! I also do care a lot about visualization and how a good visualization can be a lot more than just icing on the cake.
In this article, I want to briefly introduce Mermaid, a fantastic open (JavaScript) tool and library for representing and creating diagrams from markdown-like plain text.
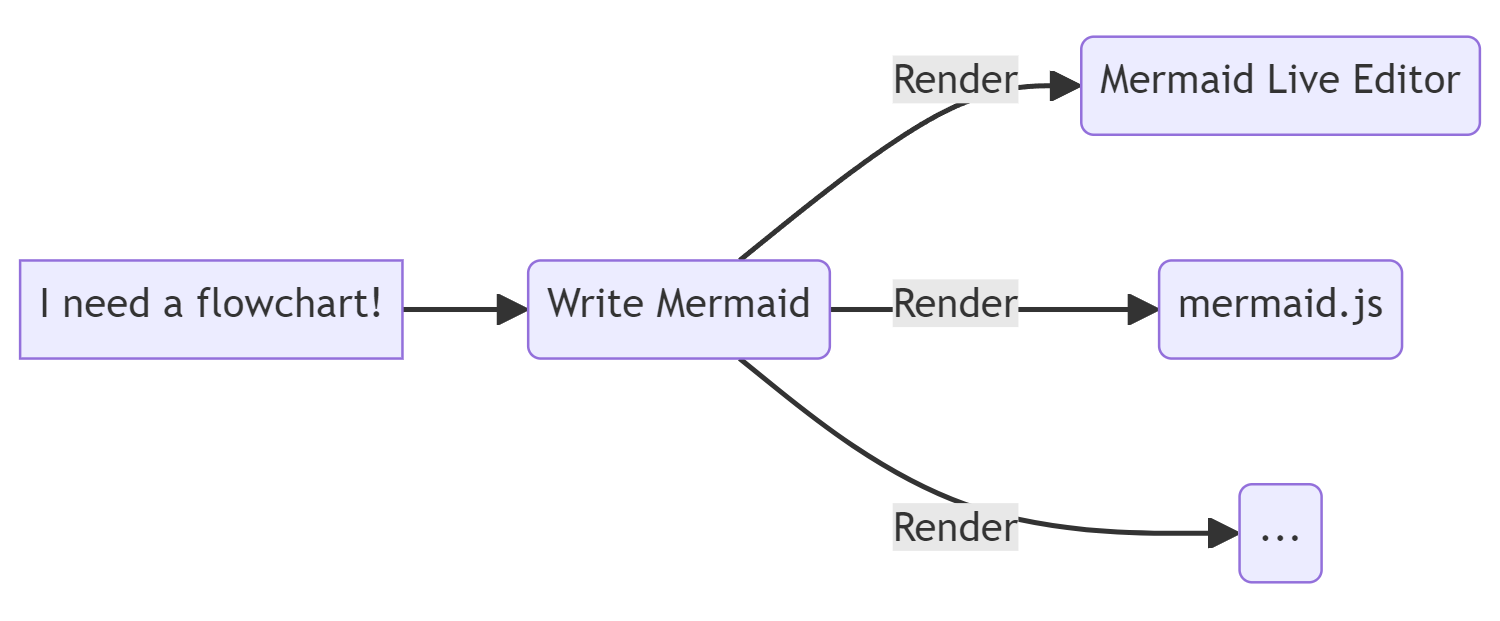
Put simply, using Mermaid, you can describe visualization – for example, a flowchart like above – in plain text and have the tool render the actual visualization. While Mermaid’s syntax is not trivial, it is highly readable and, like markdown, comprehensible to a human reader.
For example, the demo flowchart above can be represented in Mermaid like this:
flowchart LR
    A[I need a flowchart!] --> B(Write Mermaid)
    B -- Render--> C(Mermaid Live Editor) & D(mermaid.js) & E(...)
Mermaid is also a great example of a specific paradigm of working with visualization that could be called visualizations-as-code: We separate the content (and structure) from the actual presentation and store as much information as possible in plain text.
The Benefits of Using Plain Text
I adore formats and workflows based on plain text files. While there are many use cases in which more complicated formats are useful and needed, working with plain text files has a series of serious benefits.
For me, these are the three most important ones.
Simplicity of Editing and Maintenance
In most cases, think about Adobe Illustrator or even Microsoft PowerPoint, editing and maintaining visualizations is quite complicated. If changes need to be made, the graphics need to be edited in some external tool, and, depending on how sophisticated the workflow is, manually changed in the documents relying on them.
With visualizations represented as plain text, ideally within the document ultimately containing them (e.g., a paper, an article or a notebook), editing, updating, etc., does not require external tools or specific additional competencies.
The fact that the actual representation, the style, is detached from the content further simplifies things. If the style of the document needs to be changed, the visualizations do not need to be recreated.
This is very similar to using code and/or code notebooks (e.g., Jupyter Notebooks) and programmatically creating visualizations using tools such as ggplot2 or seaborn. Naturally, there is also a Mermaid integration for Jupyter Notebooks.
Version Control
I am aware that there are sophisticated version control systems capable of working with non plain text files!
That said, I believe that it is a great asset to be able to put visualizations – well, their representation as text – into a Git repository.
Using a tool such as Mermaid, without any further changes, allows us to leverage everything great about version control when working with visualizations. This includes tracking changes and being able to revert visualizations as needed.
Compatibility
When it comes to compatibility, plain text is almost unbeatable.
First of all, no special software is needed to modify plain text files. Furthermore, having a comprehensible syntax like Markdown or Mermaid, the content can be read and understood by humans even if the rendering falls flat for some reason. Of course, with plain text files, we are also not tied to any specific software or product — this reduces the risks of lock-ins dramatically.
In addition, plain text is very searchable. This allows us to perform searches that include our visualizations without resorting to, for example, OCR or the like.
Of course, we still rely on specific software, e.g., Mermaid, to render the files. However, with sufficient knowledge of the syntax, we could always use and/or recreate an alternative renderer.
Bonus: Compatibility with Generative AI
Another useful side-effect is that Large Language Models are able to create and modify Mermaid code. For example, ChatGPT is quite capable of creating visualizations using Mermaid. These can then be rendered using the techniques outlined below.
All of that said, this approach also has a lot of downsides, especially when it comes to complicated, non-standard visualizations or when we need as much control over the visual aspects as possible.
Creating Diagrams Using Mermaid
As stated above, a Mermaid visualization, at first, is a description (or representation) of the graphic in plain text using the Mermaid syntax. Then, this description is rendered into the actual presentation using a number of available tools based on the Mermaid library.
Mermaid, by default, features quite a few types of visualizations, ranging from flowcharts over mindmaps to Gantt charts and timelines. There is also a rich ecosystem around Mermaid and many common visualization tasks can be solved using it. That said, Mermaid, in my mind, is definitely not the go-to for data visualization – it is much more suited for diagrams and, for example, project or systems related tasks.
For data visualization, despite its very different approach, I would definitely have a look at D3. Naturally, D3 is also used internally by Mermaid!
Syntax
Mermaid’s syntax is relatively easy to read and can be learned within a day or so (see Syntax Reference).
A basic diagram will look something like this:
Diagram Type

    Diagram Content
Applied to a simple timeline, we are looking at something like this:
timeline
    2020 : A
    2021 : B
         : C
    2023 : D
    2024 : E
timeline
    2020 : A
    2021 : B
         : C
    2023 : D
    2024 : E
Mermaid can also be configured. How this is done depends on your specific implementation. However, a simple way is using the so-called Frontmatter Config:
---
title: Timeline Example
config:
  theme: base
  themeVariables:
    primaryColor': "#26B691"
    lineColor: "#26B691"
---

timeline
    2020 : A
    2021 : B
         : C
    2023 : D
    2024 : E
---
title: Timeline Example
config:
  theme: base
  themeVariables:
    primaryColor: "#FFF"
---

timeline
    2020 : A
    2021 : B
         : C
    2023 : D
    2024 : E
Here, we have defined a title as well as changed the primary color of the theme. Of course, the ultimate style and visual appeal will be defined by the application you are using to render the Mermaid code.
Mermaid Live Editor
The easiest way of working with Mermaid is the Mermaid Live Editor, a web application that allows you to create and export visualizations.
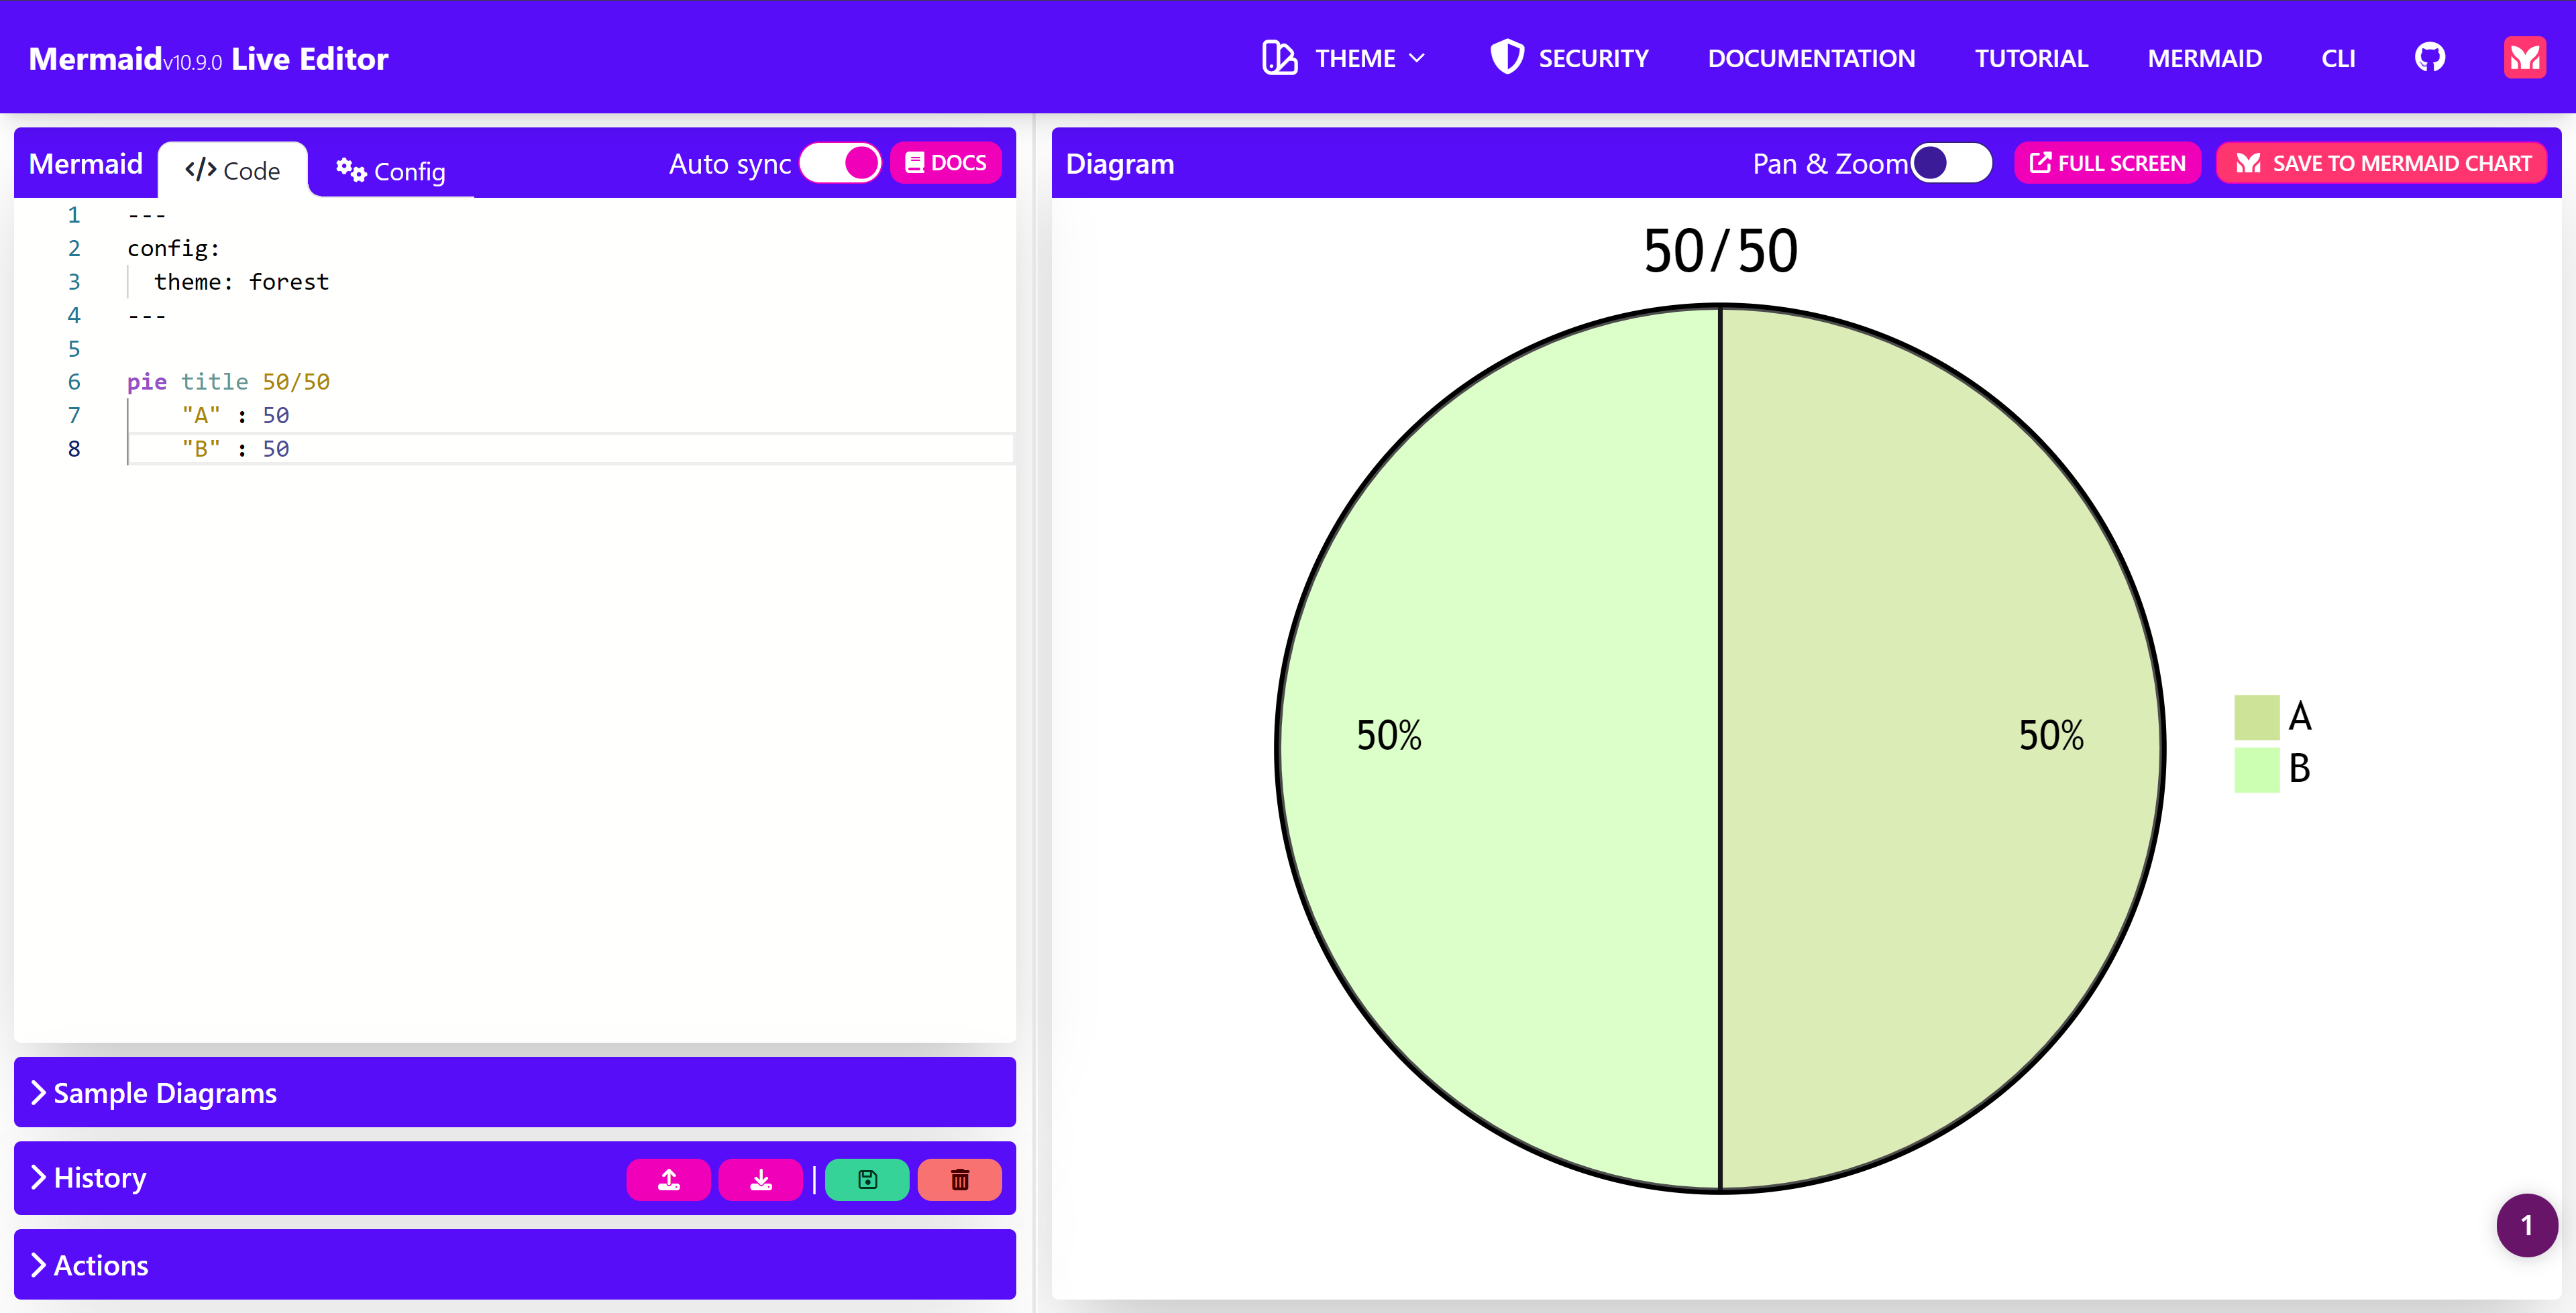
---
config:
  theme: forest
---

pie title 50/50
    "A" : 50
    "B" : 50
As you can see, the Mermaid code is to the left, and the graphic’s actual presentation is to the right.
In addition to the example above, here we are also using the theme configuration to change the appearance using the forest style.
The tool also allows the export of visualizations in various formats, including SVG.
There is also a commercial offering, Mermaid Chart, that is tightly linked with the open-source project. Mermaid Chart, essentially, is a very powerful editor for creating diagrams and visualizations using Mermaid.
Mermaid.js
When using Mermaid to create websites or web applications, mermaid.js is the way to go. For example, here is the same flowchart from above rendered using mermaid.min.js:
flowchart LR
    A[I need a flowchart!] --> B(Write Mermaid)
    B -- Render--> C(Mermaid Live Editor) & D(mermaid.js) & E(...)
This has been achieved by simple doing the following:
<script src="/assets/vendor/mermaid/mermaid.min.js"></script>

<pre class="mermaid">
flowchart LR
    A[I need a flowchart!] --> B(Write Mermaid)
    B -- Render--> C(Mermaid Live Editor) & D(mermaid.js) & E(...)
</pre>
While this is a straightforward way of displaying visualizations on websites or within web applications, the Mermaid project also features a rich ecosystem providing ample opportunities for developers.
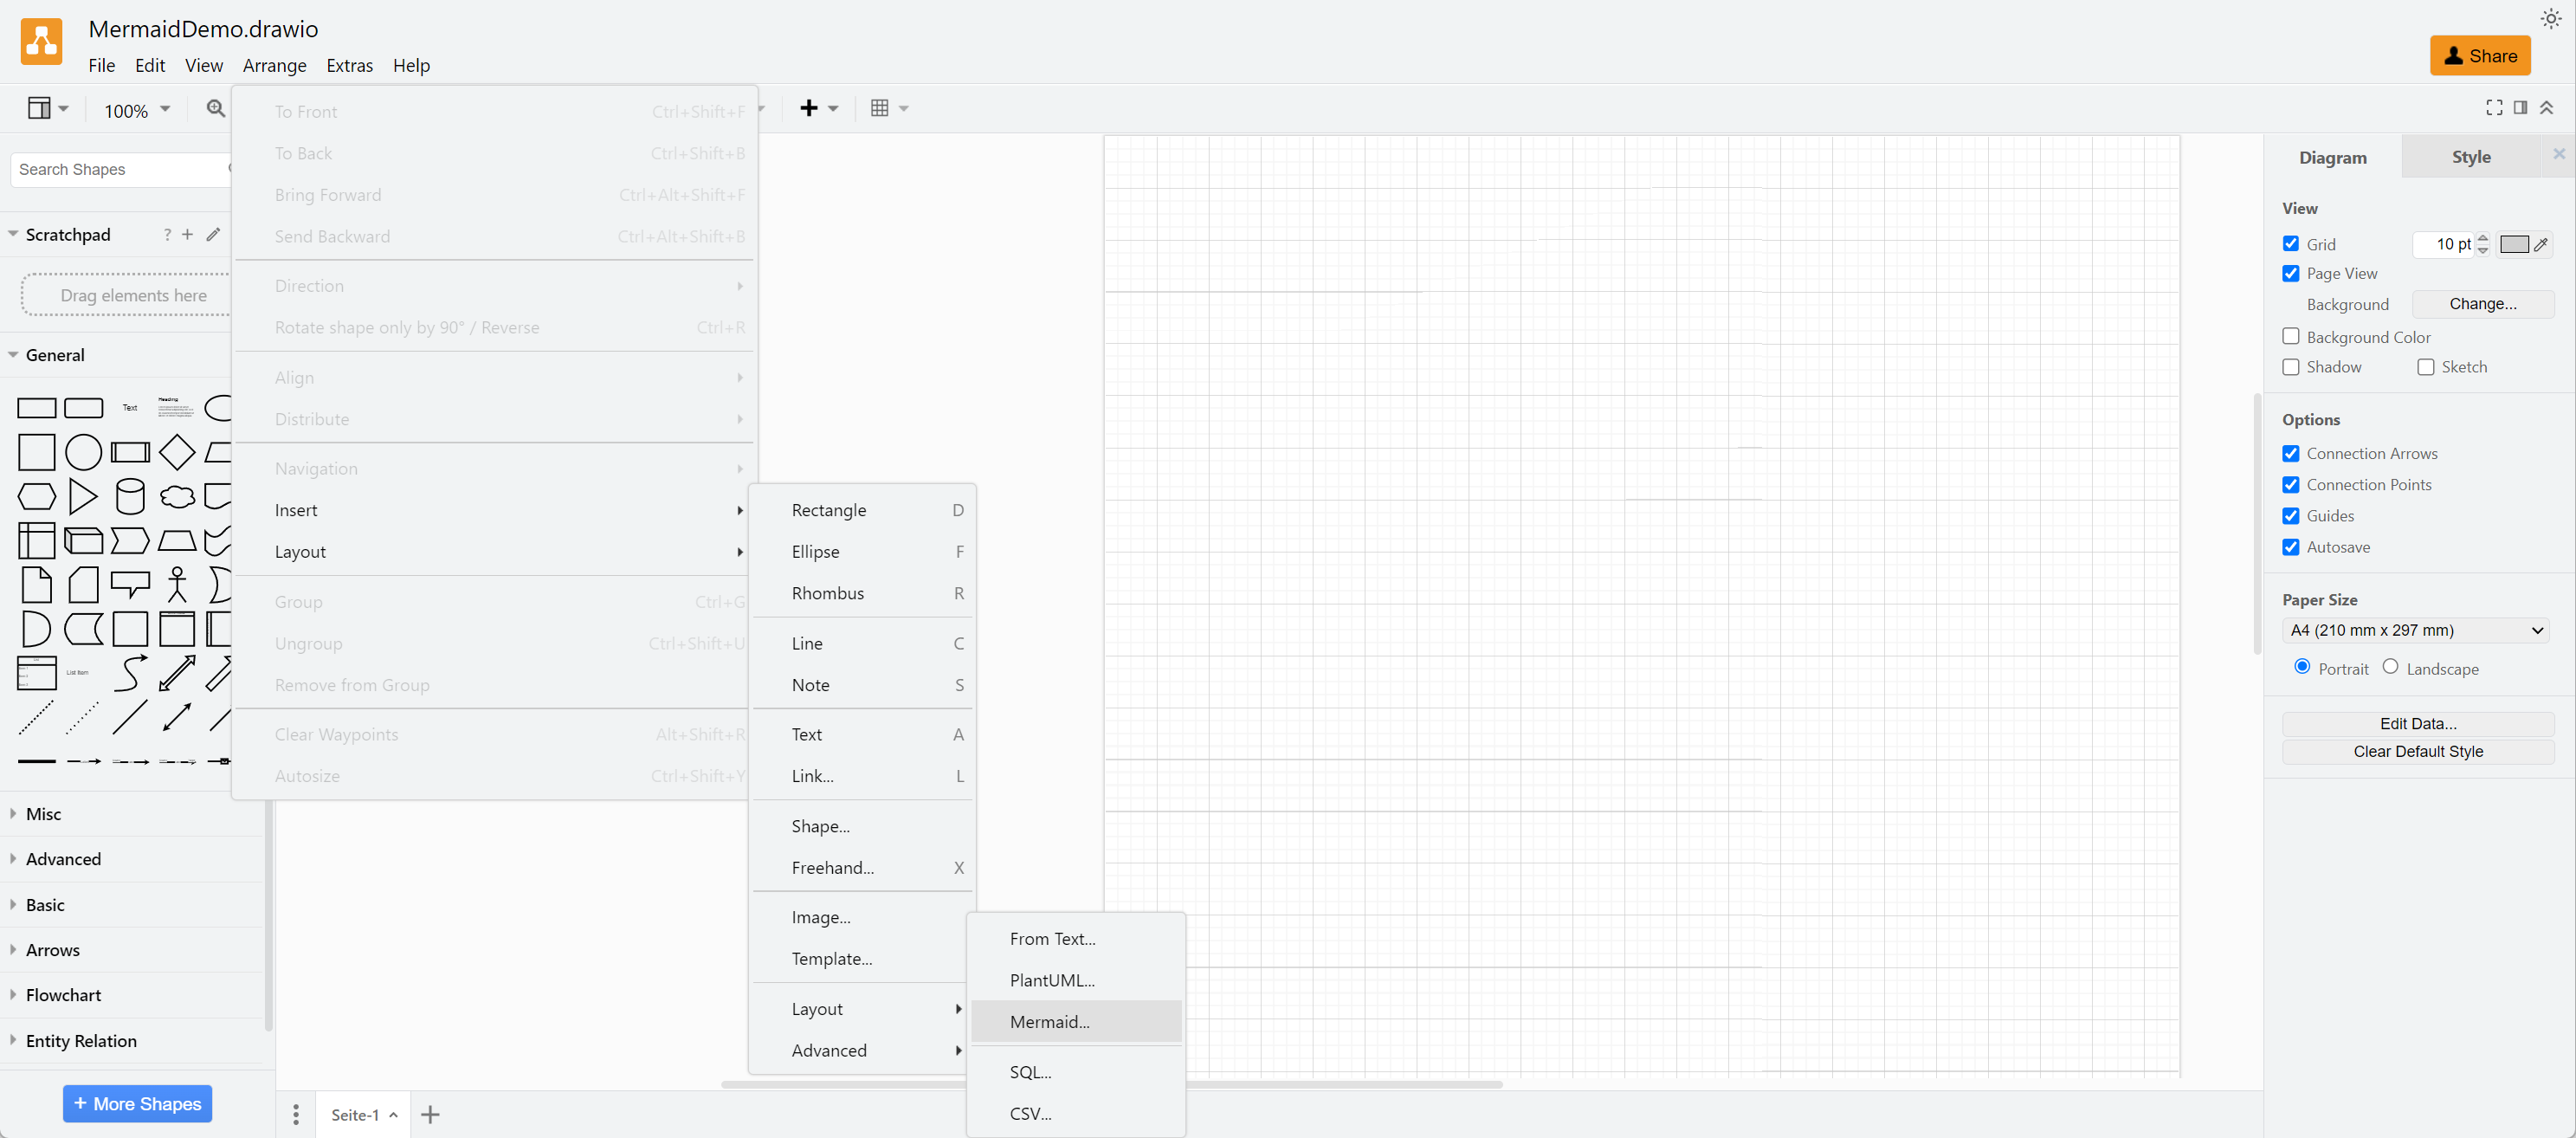
External Tools
There is a growing number of tools that support Mermaid. For example, Draw.io supports Mermaid.
Mermaid is also adopted by more and more platforms. GitHub, for example, supports Mermaid and Mermaid syntax can be used when writing on GitHub.
Conclusion
I truly enjoy Mermaid as an “extension” of Markdown that allows me to create visualizations, primarily diagrams, in plain text. The syntax is readable and easy enough, and there are plenty of integrations. I also do enjoy that Mermaid has become, in many ways, the standard for solving this particular task.
That said, Mermaid, at least by default, could be more extensive in what it can do. There are many (!!) use cases in which another library (e.g., D3) or more traditional approaches (e.g., Adobe Illustrator) are the way to go.
However, given the benefits of plain text, I would also consider using a solution like Mermaid (or the more specialized PlantUML) when a more complex solution is not needed.

Thank you for visiting!
I hope, you are enjoying the article! I'd love to get in touch! 😀
Follow me on LinkedIn